
A good running infographic does one thing well: it makes a single idea stick. Here are six worth a look.
None of these were made here. Each one is credited to whoever did make it, with a link back to the source.
How to start running
The whole sport in three steps. Put on running shoes, go outside, just run.
It really is that simple for the first few weeks.

Source: Luke Ma on Flickr
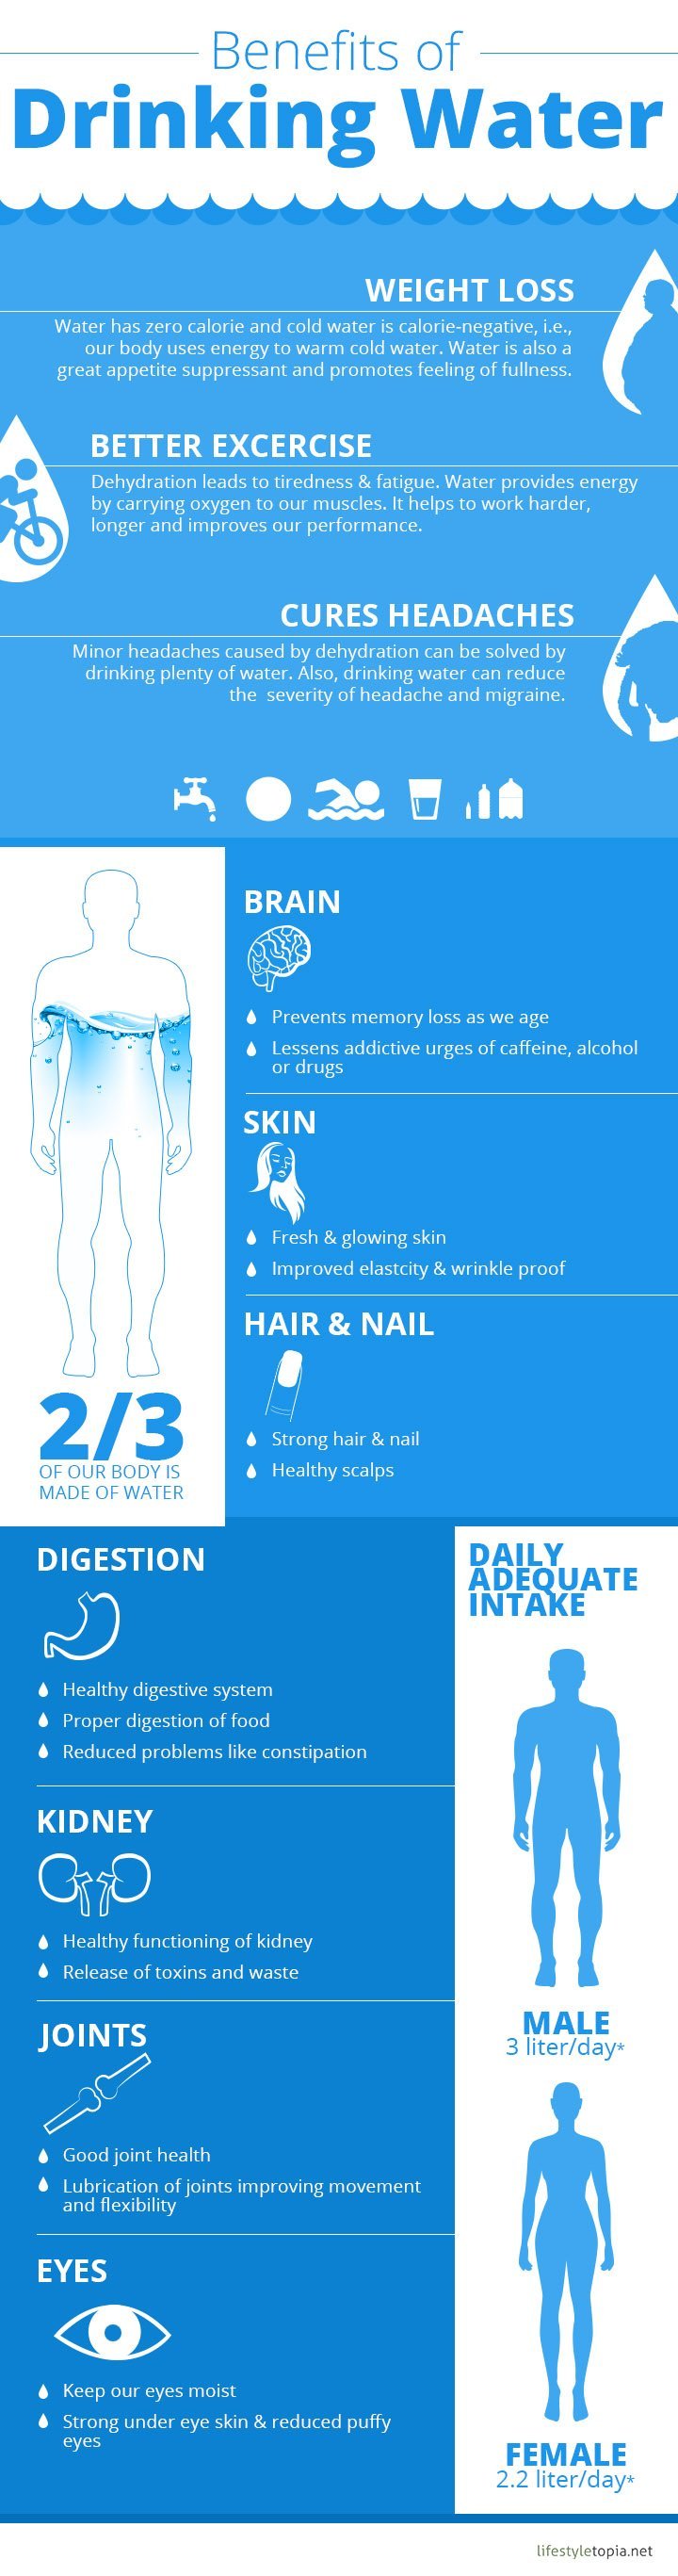
Benefits of drinking water
Water does more for a run than most people credit it with. Dehydration costs you energy on a run and gives you a headache on an ordinary day.
Our guide to how much runners need to drink covers the amounts.
Source: Lifestyletopia
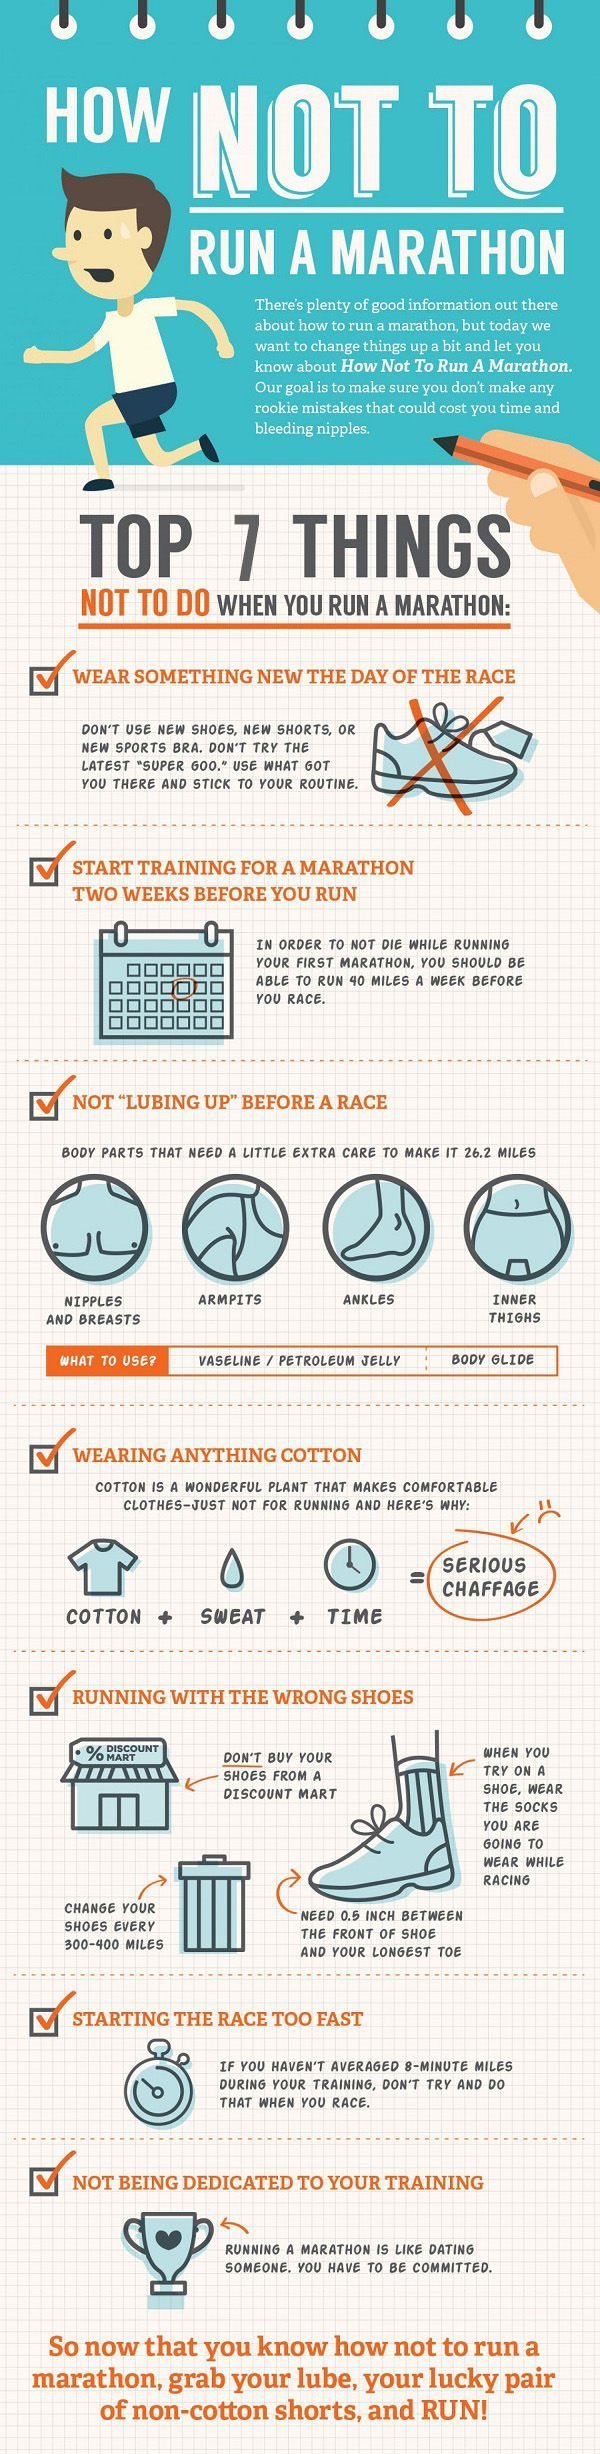
How not to run a marathon
Every rookie mistake in one picture. The number one entry is wearing something new on race day.
Read it as a checklist of what to avoid in the last week.
Source: ProForm
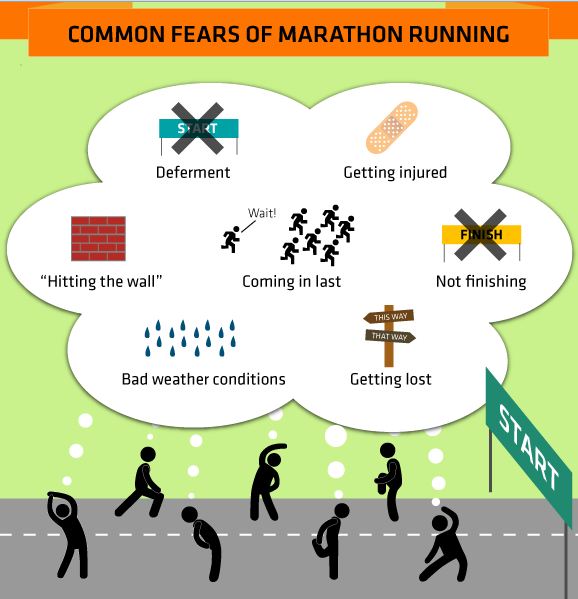
Common fears of running a marathon
Bad weather and coming last sit at the top of the list for marathon runners.
Mud runners worry about almost none of it, because there the hazards are the point.
Source: Tribe James
Are mud runs more popular than marathons?
Mud runs are more social and less committal, and you can skip an obstacle if you want to.
The average mud runner is 26. The average Boston Marathon finisher is 39.

Source: Blood Sweat and Cheers, whose domain no longer belongs to the original site
Fun and wacky running races
Events with no winners and no official times, built to get people out together.
First timers and seasoned racers line up at the same start.

Source: NordicTrack